An Unsatisfying Adventure
As a software developer, I know first-hand how difficult it is to build quality products quickly and cheaply. It’s an art form that we sometimes get right, and other times devolves into something akin to the Obama era healthcare government site. Our level of control over the resulting product varies, and blame for failure often falls on the wrong people in the decision-making hierarchy. Microsoft’s Azure DevOps (formerly known as Visual Studio Team Services), despite clearly good intentions, is a perfect storm of bad decisions and poor execution.
From a high level, the product looks fantastic. It offers an all-in-one solution to issue tracking, CI, version control, project management, and more. Unfortunately, its complexity is part of its problem. When issues are updated, other screens frequently do not refresh, leaving you unaware of changes. For example, updating hours or setting effort does not trigger graphs to update; a page refresh is still required. While these problems are small when isolated, together they make the product arduous for day to day tasks.
Honestly, everything mentioned so far is tolerable, though unfortunate. Every tool has its problems. What really “grinds my gears” is the CI system which they call Pipelines. The CI implementation is, from my perspective, horrifically broken. All the individual problems, such as incomplete Github integration (which they now own, by the way), to the way agents running builds randomly die, to the way it’s the year 2019 and they still don’t offer any form of build caching, combine to create a product that is disappointingly subpar in comparison to other tools such as GitLab, CircleCI, Travis, and others.
My primary hope is to help you, the reader, save yourself from some of the mistakes I’ve made using this tool. My secondary hope is to reach someone at Microsoft who makes decisions and convince them to fix these problems ASAP —we are, after all, paying them money for this tool and also paying for every additional agent we [attempt to] use for CI. Lastly, let me clarify that I’ve already contacted support for many issues, with no positive outcome.
Viewing Your Builds
1080p Need Not Apply
Curiously, the build information page hides significant amounts of data if you commit the cardinal sin of not having a big enough monitor. Even with standard 1920x1080 resolution, it’s impossible to see all the columns at once. Surely you are thinking to yourself, “Wow, this guy doesn’t know how to scroll horizontally.” Actually I do, Microsoft doesn’t.

Barely any information is displayed about each build. Also note, no horizontal scrolling. The blacked-out areas identify some commits and their authors. Additional blackouts hide some of my company’s information and other sensitive information.

Ah, look at all that beautiful information. Sadly, this window still isn’t large enough to see all of the available columns.
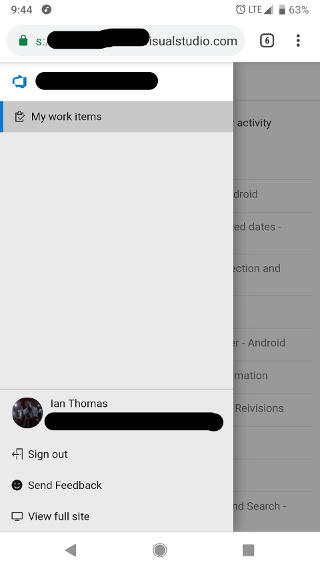
Some of you may be wondering what happens on mobile. Mobile is completely unsupported for the CI area of the tool. Even if you bypass its mobile-friendly views using desktop mode, you can’t change your screen size, and so the majority columns are completely inaccessible. To the best of my knowledge, no native mobile app exists either.

I hope all you are looking to do is view tasks assigned to you.
Thou Shall Not Build
A Sad but True Story
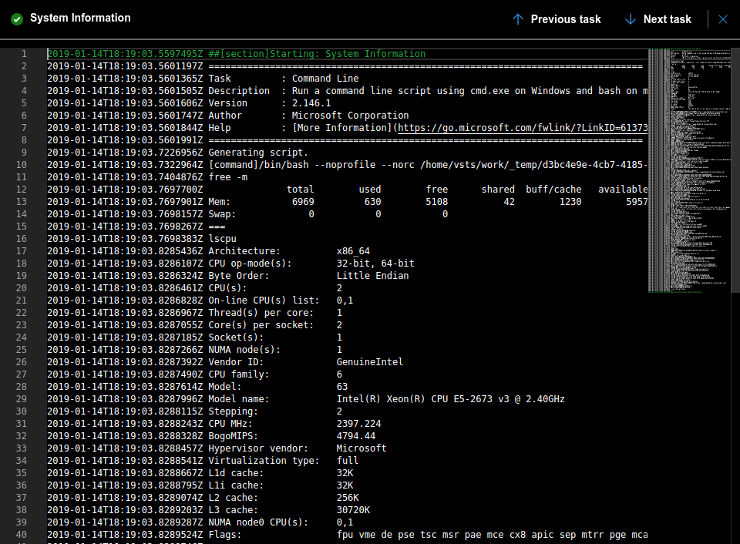
Either Microsoft’s network, the CI worker agent service, or some combination of both are completely broken. Using a Microsoft-hosted agent running Linux, you are provisioned a Windows server running Ubuntu in a hypervisor. Generally, build machine instances get approximately 6GB of usable memory and two E5 Xeon Intel cores.

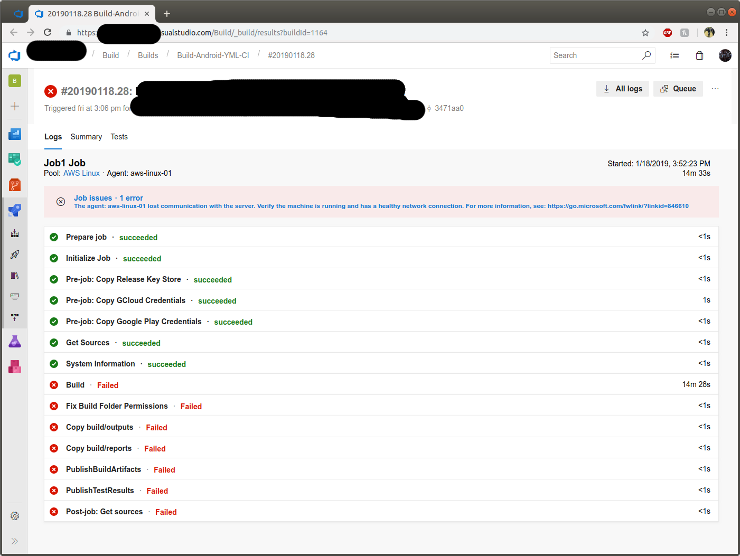
Running hosted builds, we experienced a high rate of build failures caused by machines disappearing into the ether. These failures happen at random points, sometimes before the build even starts. The general cause is always the same: “lost communication with the server”. After spending months hoping for this problem to be resolved, asking support for help, and suffering from their rather inadequate issue tracker, we decided to just set up our own self-hosted agent on AWS. We hoped it would fix everything and it did! Our builds were blazing fast and ten minutes later, “lost communication with the server”.

Unfortunately, the problem runs deeper than just on their hosted agents and it seems to also affect self-hosted ones running on our own instances. Investigating the issue further, I realized our EC2 instance was completely unresponsive. Ok, I thought, I must have gotten a bad server or something must have gone wrong. I terminated the instance, created a new one, and set up the agent again. Surely all would be well now!
For a few hours, builds ran smoothly. As expected, eventually the agent died during a build. Builds sat queued, my frustration grew, and AWS notified my instance needed a doctor. After an hour I gave up hope for the unresponsive server and commanded it to reboot. In an attempt to debug the problem I investigated the traditional log locations such as dmesg, kern, and the var log. I was unable to determine any root issue or find any indication of what happened.
Checking on Your Build
To Log or Not to Log
One of the most curious implementation decisions is the build log. If you already have the build information page open when a build is triggered, you can see the entire build history. If you are a normal and human don’t peek in on the build for several minutes, you can only see history from the point you loaded the build log for the currently running step. In my primary role as an Android developer, the first build output I see is often something like :app:assembleDebug, ergo, the beginning of the log is missing. It is possible to refresh the page after the build finishes to view the entire log, but this often turns into an unfortunate time sink.

Dear Cache
Cache Me Ousside
You might not believe me when I tell you Microsoft has absolutely no form of build caching. As such, I’ll just link you directly to people begging for it and Microsoft’s insistence they are thinking about implementing it. They acknowledged they were working on the issue in February 2018. It’s now 2019 and… nothing. This issue, while annoying, actually spins off a completely separate problem. If you search Google, many users encounter network issues with their builds, myself included. Presumably, the lack of build caching is overwhelming their network and also causing their build servers to get rejected by package repository systems. In our builds, we frequently hit HTTP errors downloading dependencies resulting in flaky builds. We track a high number of build failures due to network issues excluding the percentage of failures attributed to the dreaded “lost communication” message described previously. Sometimes builds even fail to attempt to connect to Github performing the source checkout.
It’s extremely confusing to me that Microsoft, a company which owns their own cloud services, lacks caching in their CI implementation. Other CI offerings on the market like Circle, Travis, Jenkins, etc, all generally have cache implementations and treat it as a fundamental part of the CI process. Please, Microsoft, can we have it now?
Failed to Build
Github Who?
Another interesting implementation issue with CI is the communication (or lack thereof) with Github. When a build fails, such as when the CI system is flaky, re-queuing the build from the dashboard does not update Github on completion. This means you must push either erroneous commits, or force push changes onto pull requests to trigger new builds that will update your Github PR. In practice, this isn’t really an issue since CI systems generally aren’t flaky - or so I thought. As a strong supporter of systems like Travis and Circle, I’ve convinced many people to pony up the money for their services. They generally work well and exhibit none of the issues Microsoft has in regards to manually queued builds not updating Github. Regardless, multiple times a week my coworker and I have to spend extra time to deal with our quality checks blocking pull requests.